Debugging the Grid component
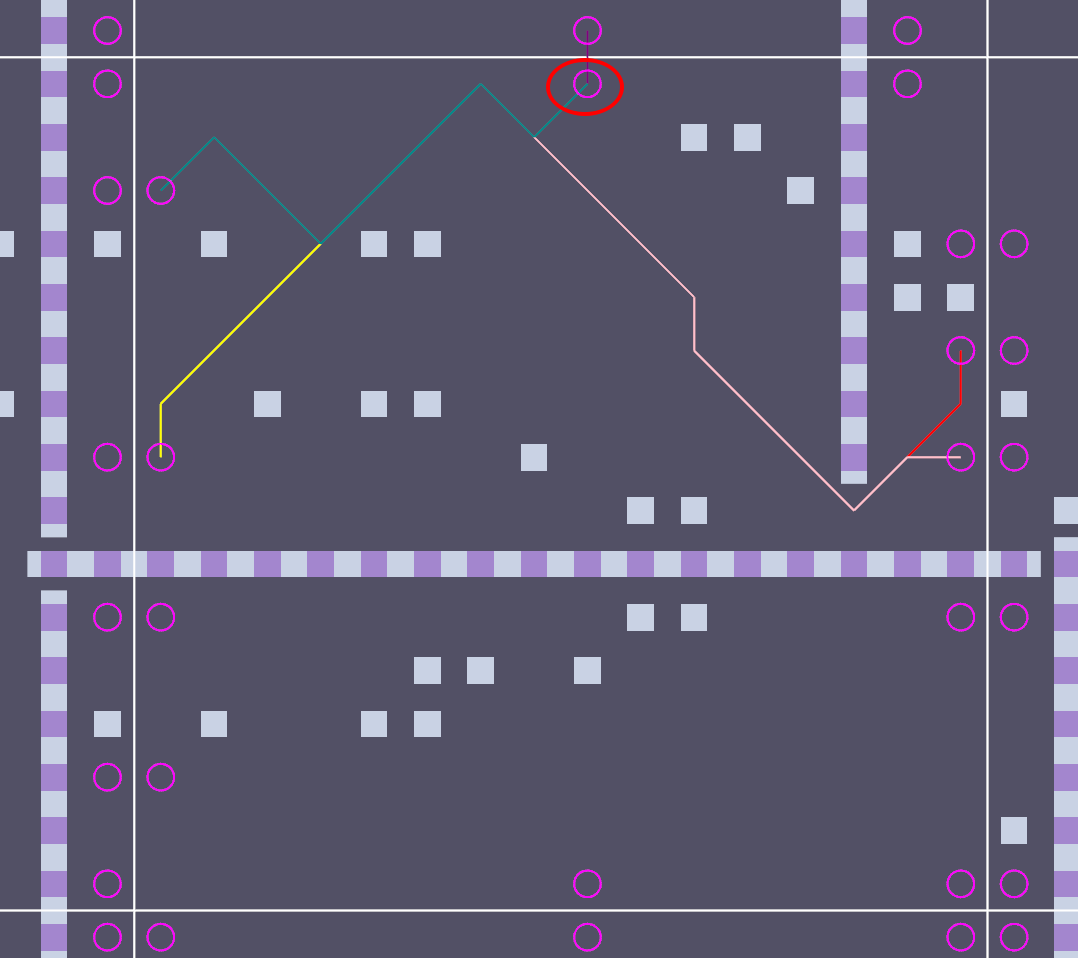
The NorthstarDebugPlugin adds systems that can be enabled to draw gizmos to display the following:
- Chunk grid: Grid outline of where the chunks are
- Entrances: Calculated entrances at the boundaries of the chunks
- Cached internal paths: Cached paths inside the chunk between its own entrances.
- Cells: Each individual cell on the grid and its passable status
- Paths: Draws the current calculated path components
First, add the NorthstarDebugPlugin to your app.
Then insert the DebugGrid component a child of the entity that the Grid you want to debug is attached to.
You will likely also want to add a DebugOffset component to the same entity as DebugGrid to align the gizmos with your world tilemap position. In this example we'll be using components from bevy_ecs_tilemap to assist with determining our offset.
use bevy::prelude::*;
use bevy_ecs_tilemap::prelude::*;
use bevy_northstar::prelude::*;

fn main() {
    App::new()
        .add_plugins(DefaultPlugins)
        .add_plugins(NorthstarPlugin::<CardinalNeighborhood>::default())
        // Adding the NorthstarDebugPlugin
        // You need to specify the neighborhood here as well
        .add_plugins(NorthstarDebugPlugin::<CardinalNeighborhood>::default())
        .add_systems(Startup, startup)
        .run();
}

fn startup(mut commands: Commands, asset_server: Res<AssetServer>) {
    // Query or create your bevy_ecs_tilemap TilemapAnchor
    let anchor = TilemapAnchor::Center;

    // Query or create your bevy_ecs_tilemap TilemapSize, TilemapGridSize, and TilemapTileSize. They are required for calculating the anchor offset.
    let tilemap_size = TilemapSize { x: 64, y: 64 };
    let tilemap_gridsize = TilemapGridSize { x: 8.0, y: 8.0 };
    let tilemap_tilesize = TilemapTileSize { x: 8.0, y: 8.0 };

    // Store our offset
    let offset = anchor.as_offset(
        &tilemap_size,
        &tilemap_gridsize,
        &tilemap_tilesize,
        &TilemapType::Square,
    );

    // Let's pretend we loaded a tilemap asset and stored it in a handle and now we're spawning the entity for it.
    let mut map_entity = commands.spawn(anchor);

    // Call `build()` to return the component.
    let debug_grid = DebugGridBuilder::new(64, 64)
        .enable_chunks()
        .enable_entrances()
        .build();


    // Spawn an entity with the Grid and DebugMap component as a child of the map entity.
    let grid_entity = map_entity.with_child(
        CardinalGrid::new(&GridSettingsBuilder::new_2d(64, 64).build())
    );

    grid_entity.with_child((
        debug_grid,
        DebugOffset(offset)
    ));
}
Debugging in 3d
Debug Gizmos are available for 3d voxel maps. Use DebugTilemapType::Square3d for the tilemap type.
You can set it when you initialize and build DebugGridBuilder with:
#![allow(unused)]
fn main() {
DebugGridBuilder::new(1, 1).square_3d()
}
Using enable_cells() to draw cell gizmos in 3d will only draw gizmos at open cells. Even with that filter, it will greatly impact rendering performance. Only recommended if you're struggling to debug an issue.
Debugging Paths
Debugging paths for an entity requires you to add a DebugPath component to the entity or entities of your choosing. This component allows you to selectively debug specific paths.
Drawing the path gizmos also requires the NorthstarDebugPlugin to add the gizmo drawing system.
#![allow(unused)]

fn main() {
commands.spawn((
    Name::new("Player"),
    DebugPath::new(Color::srgb(1.0, 0.0, 0.0)),
    // Attach the entity to a grid. If AgentOfGrid is already present, you don’t need to add it again.
    AgentOfGrid(grid_entity),
));
}
If you would like to debug a directly created path (returned from grid::pathfind()) make sure you attach the returned Path component to your entity. If you're not using NorthstarPlugin you will also need to make sure the entity has an AgentPos component. This is the query filter used to debug paths Query<(&DebugPath, &Path, &AgentOfGrid)>.
See Getting Started for more information on using AgentOfGrid.
DebugGridBuilder Settings
isometric()
Sets the debug gizmos to draw in isometric perspective.
square_3d()
Sets the debug gizmos to true 3d. Needed for 3d voxel games.
swap_yz()
Swaps the y and z axes for the debug gizmos.
There's a disconnect between Psuedo 3d and Full 3d xyz coordinates.
Until we have grid wrappers this is the easiest way if you need to remap the coordinates.
Only affects DebugTilemapType::Square3d.
enable_chunks()
Outline the grid chunk regions.
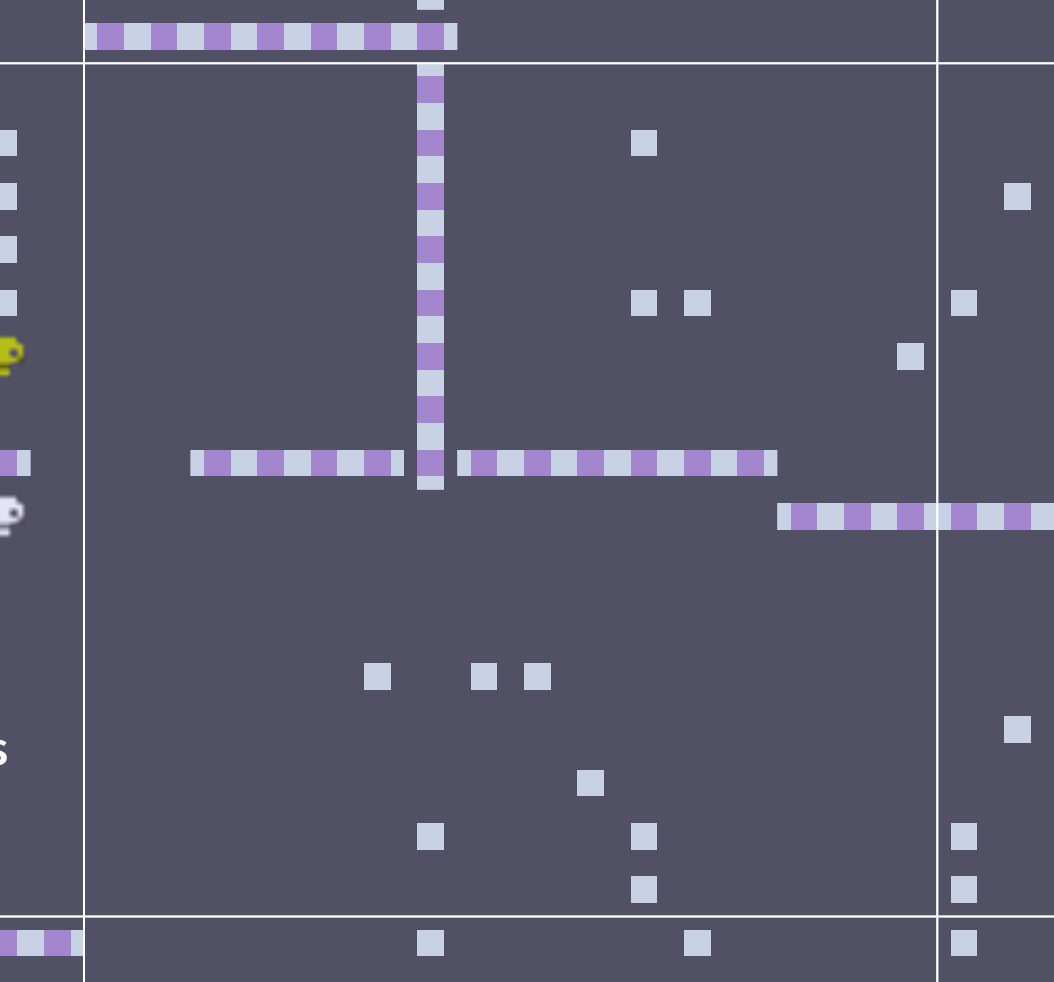
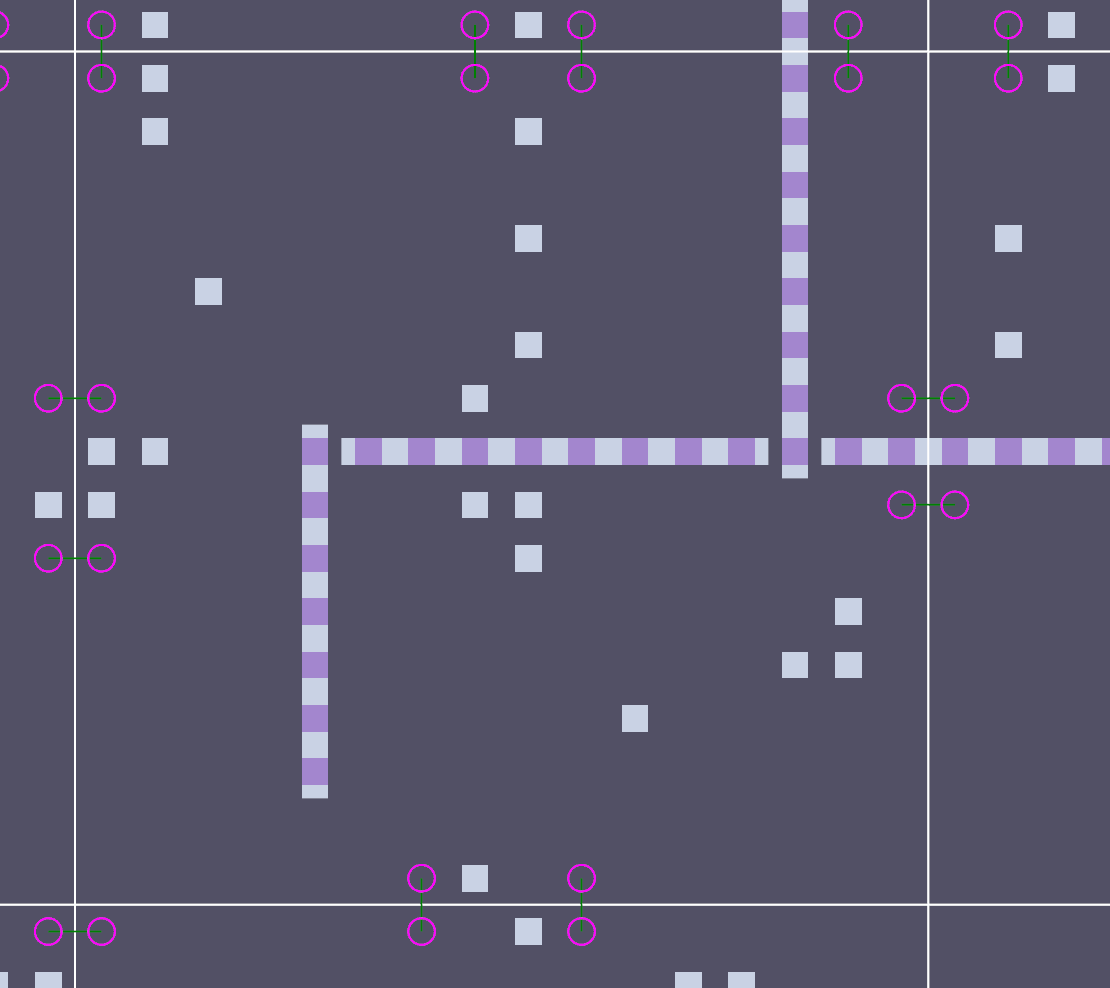
enable_entrances()
Highlights the entrances created between each chunk. Very useful for debugging HPA* issues.
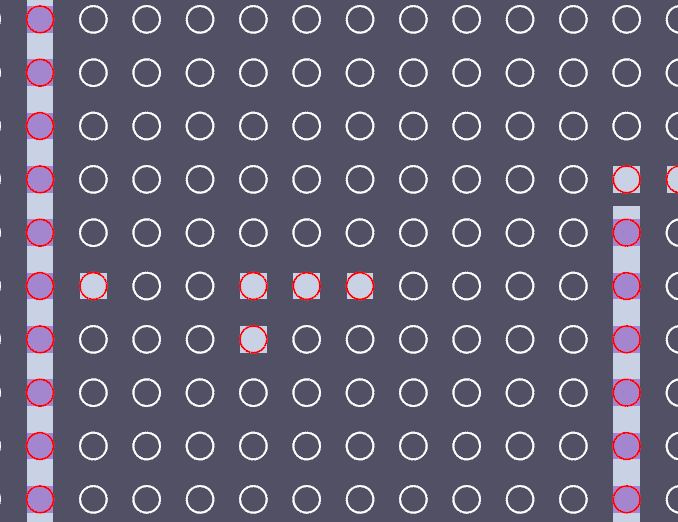
enable_cells()
Overlay over each tile whether it's passable or impassable. Useful for debugging if you're calling set_nav correctly for your tilemap.
enable_cached_paths()
Grid precaches paths between all entrances inside each chunk. Noisy, but can help debug HPA* pathing issues.
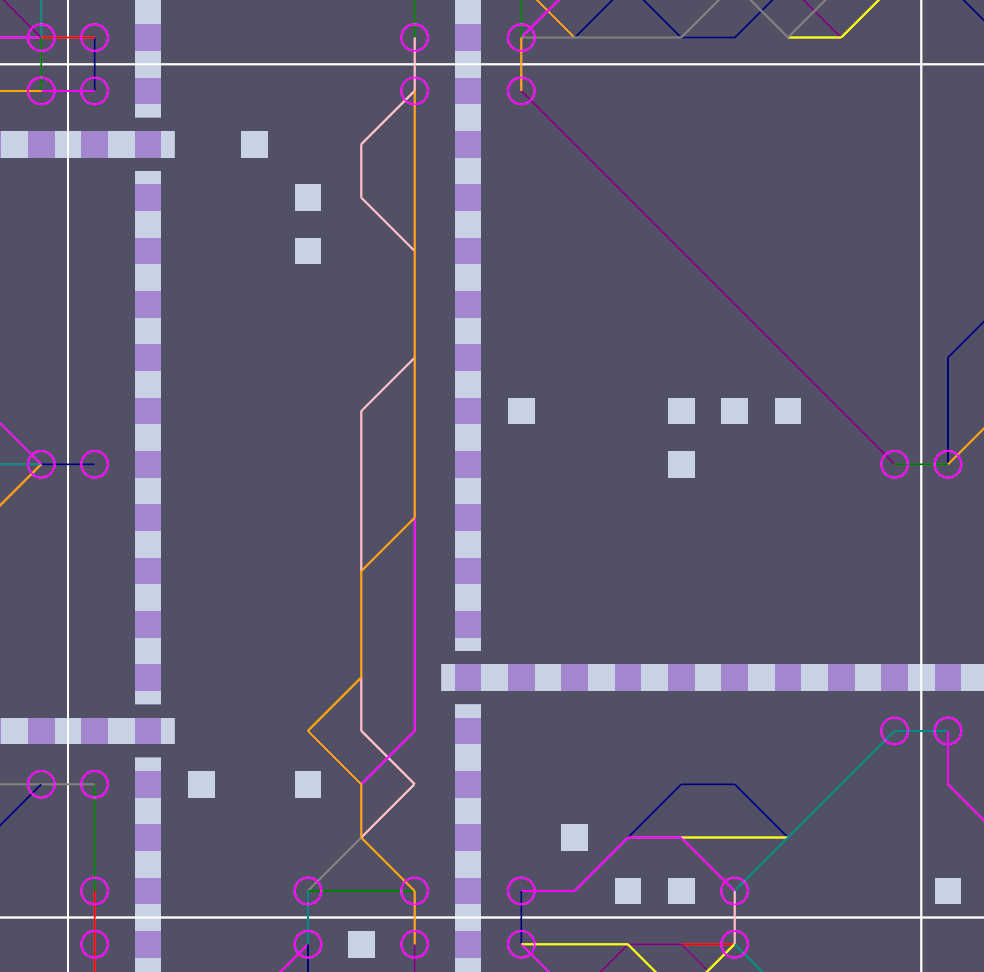
enable_show_connections_on_hover()
As you can see above, viewing all the connections at once is quite noisy. Enabling show_connections_on_hover will only draw chunk entrance cached connections when the DebugCursor position is over the node. Very useful for debugging possible failed node connections without all of the other connections overlapping.
DebugCursor Component
In order for the debug plugin to determine which node your cursor is hovering over, you need to manually update the DebugCursor component. While tedious this is required because not every game will have the same windowing and camera setups. DebugCursor is inserted along with DebugGrid so there is no need to insert it manually.
Note: The DebugCursor doesn't currently work in true 3d with the Square3d debug plugin setting.
For most cases you can just dump the raw world cursor position in your input systems or just add a simple system to handle it:
#![allow(unused)]
fn main() {
fn update_debug_cursor(
    window: Single<&Window>,
    camera: Single<(&Camera, &GlobalTransform)>,
    debug_cursor: Single<&mut DebugCursor>,
) {
    let window = window.into_inner();
    let (camera, camera_transform) = camera.into_inner();
    let mut debug_cursor = debug_cursor.into_inner();

    if let Some(cursor_position) = window
        .cursor_position()
        .and_then(|cursor| camera.viewport_to_world_2d(camera_transform, cursor).ok())
    {
        debug_cursor.0 = Some(cursor_position);
    } else {
        debug_cursor.0 = None;
    }
}
}
2.5D Debugging
Drawing all 3D grid debug gizmos over a 2d tilemap render would get pretty noisy so the debug drawing generally only draws information for one z depth at a time. The exception for this is that all entrance nodes will be drawn and y offsets for height will be applied.
You can set the depth with an inspector or use DebugGrid::set_depth(depth: u32) to change the depth that is being drawn.
In 2.5D maps each depth layer will generally have a Y offset applied so the tile appears higher to the player. The DebugDepthYOffsets component is used so the debugging systems know which offsets to apply when drawing at that z depth. DebugDepthYOffsets takes a HashMap<u32, f32> where the key is the z depth and the value is the offset.
For example:
#![allow(unused)]
fn main() {
DebugDepthYOffsets(
    HashMap::from([
        (0, 0.0),
        (1, 16.0),
        (2, 32.0),
    ])
)
}
Stats
Enabling the stats feature on the crate will allow the NorthstarPlugin pathfinding systems to calculate the average time spent on pathfinding and collision calls.
It will also log debug level stats for Grid::build() times. Useful making sure your grid rebuilds are staying within your frame budget.
[dependencies]
bevy_northstar = { version = "0.2.0", features = ["stats"]}
You can access the statistics from the Stats Resource.
#![allow(unused)]
fn main() {
fn print_stats(stats: Res<Stats>) {
    debug!("Collision Stats: {:?}", stats.collision);
    debug!("Pathfinding Stats: {:?}", stats.pathfinding);
}
}
To get the Grid::build() timing stats dumped to your log you'll need to enable debug level logging for the crate.
RUST_LOG=bevy_northstar=debug,bevy=info cargo run
Or alternatively configure it in code when setting up your Bevy logging.